Visualizing Molecular Components
This option enables the display and analysis of specific elements in a molecular structure, such as atoms, residues, and chains. Users can highlight or isolate parts to better understand composition and interactions, using various representations (e.g., sticks, spheres, surfaces) for enhanced clarity. Examples are provided below.
Visualize by Residue Name
Show lysines as white spheres
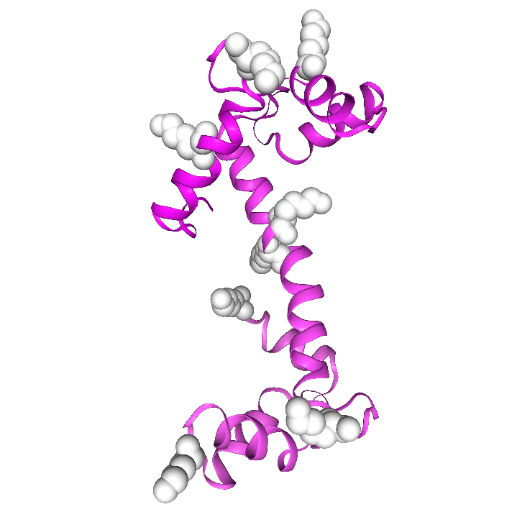
This method allows for visualization based on specific residue names, such as alanine (ala or A), arginine (arg or R), and others.
Visualize by Structural Type
Show helices as white spheres
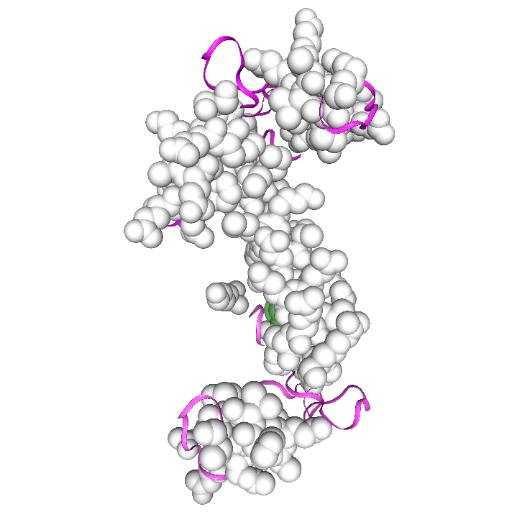
This method highlights different structural types, including helix, sheet, turn (not helix and not sheet), all, sidechain, backbone, and polymer.
Visualize Molecules by Residue Type
Show acid residues as gray spheres and basic residues as white mesh
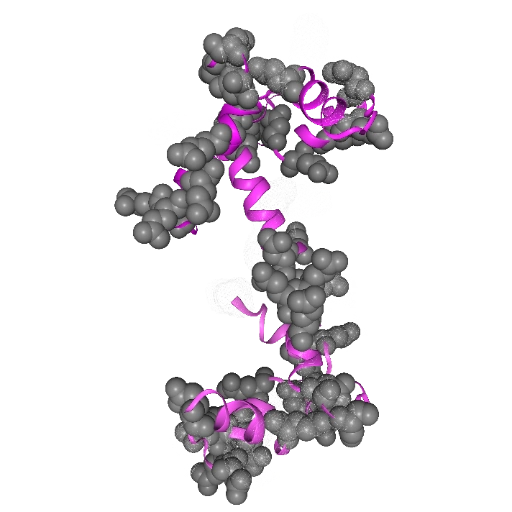
This method categorizes residues into types such as nucleophilic, hydrophobic, aromatic, amide, acidic, basic, charged, polar, nonpolar, cyclic, aliphatic, and small.
Visualize Molecules by Chain Name
Color chain A skyblue, chain B balletpink, and chains D and E seafoam
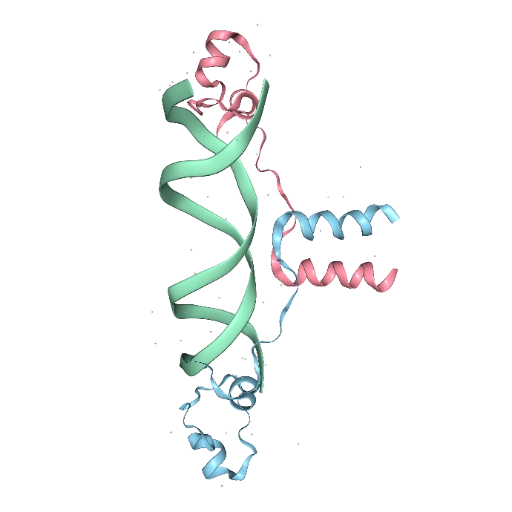
This method visualizes molecules based on their chain names, such as A, B, C, and so on.
Visualize Based on Molecule Type
Color protein seafoam, DNA pumpkin, and waters pink
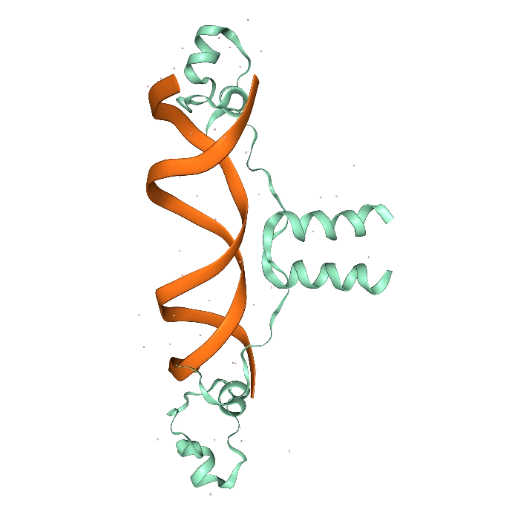
This method categorizes visualization according to molecule types, including protein, nucleic acid, DNA, RNA, hetero, ligand, ion, saccharide/sugar, polymer, and water.
Visualize by Atom Type
Color CA white, nitrogens skyblue, and oxygens pink
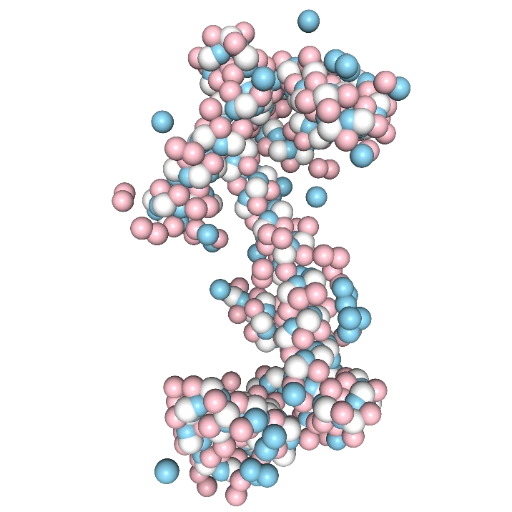
This method visualizes molecules based on atom types, including carbon (C), alpha carbon (CA), oxygen (O), nitrogen (N), hydrogen, and others.
Visualize by Residue Number
Show residues 10-20, 40, and 70 as white spheres
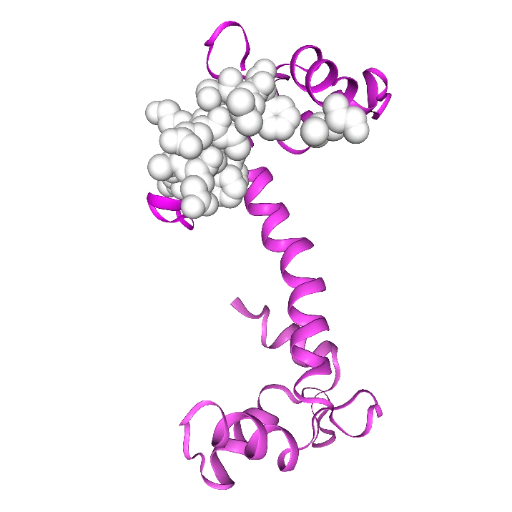
This method visualizes molecules based on specific residue numbers, such as 1, 2, 100, or ranges like 300-500.