Molecular Visualization
Molecular visualization uses computer graphics to allow users to make and manipulate 3D images of molecules, ranging from small molecules like sugar, to proteins like hemoglobin, to viruses like HIV.
Copilot, unlike PyMOL or Chimera provides a web-based platform for molecular visualization that requires no installation, no menu hunting, and no coding. With a single text prompt, it enables researchers to compare molecular structures and explore different properties in seconds.
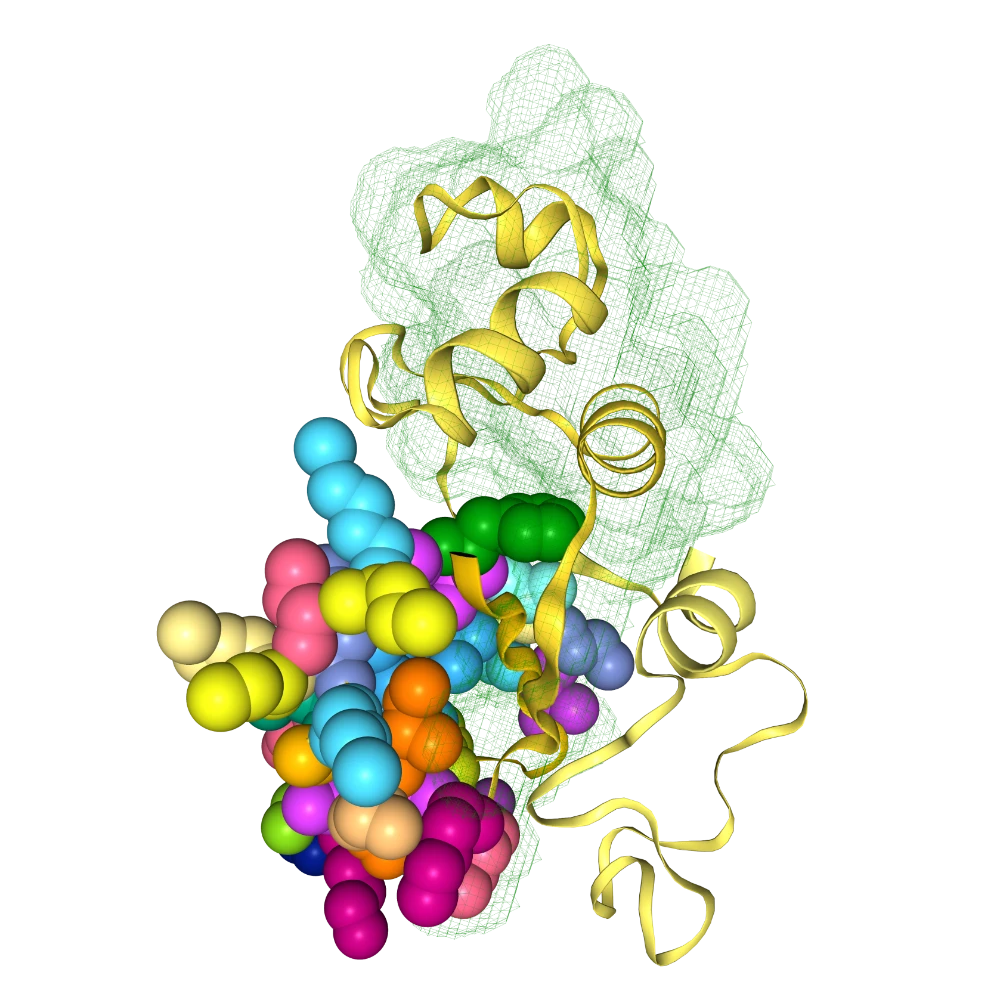
Color by residue index, show ligands as spheres, show white mesh for chain A, and show gray mesh for chain B
Being able to visualize molecules next to each other can provide information about how the molecules works and looking at the same molecules in different ways can highlights different aspects. For example, emphasizing the overall shape of a virus particle vs the electrostatic pattern around a small molecule drug. Visualization helps scientists understand the molecules they’re studying as well as communicate their findings with high quality images. Learn more about representations, colors, components, and geometry labels.
Gallery of Examples
Hide cartoon for chain A and chain B. Then, color chain A spheres size 0.3 pink, chain A mesh blue, chain B licorice blue, and chain B cartoon pink
Color chain A #FFB800 and ribbon in gray. Color chain B cartoon gray with ribbon color #FFB800. And show ligands as spheres colored by element
Change 10-50 to spacefill of resname color only for carbon atoms. Change 50-100 to green mesh
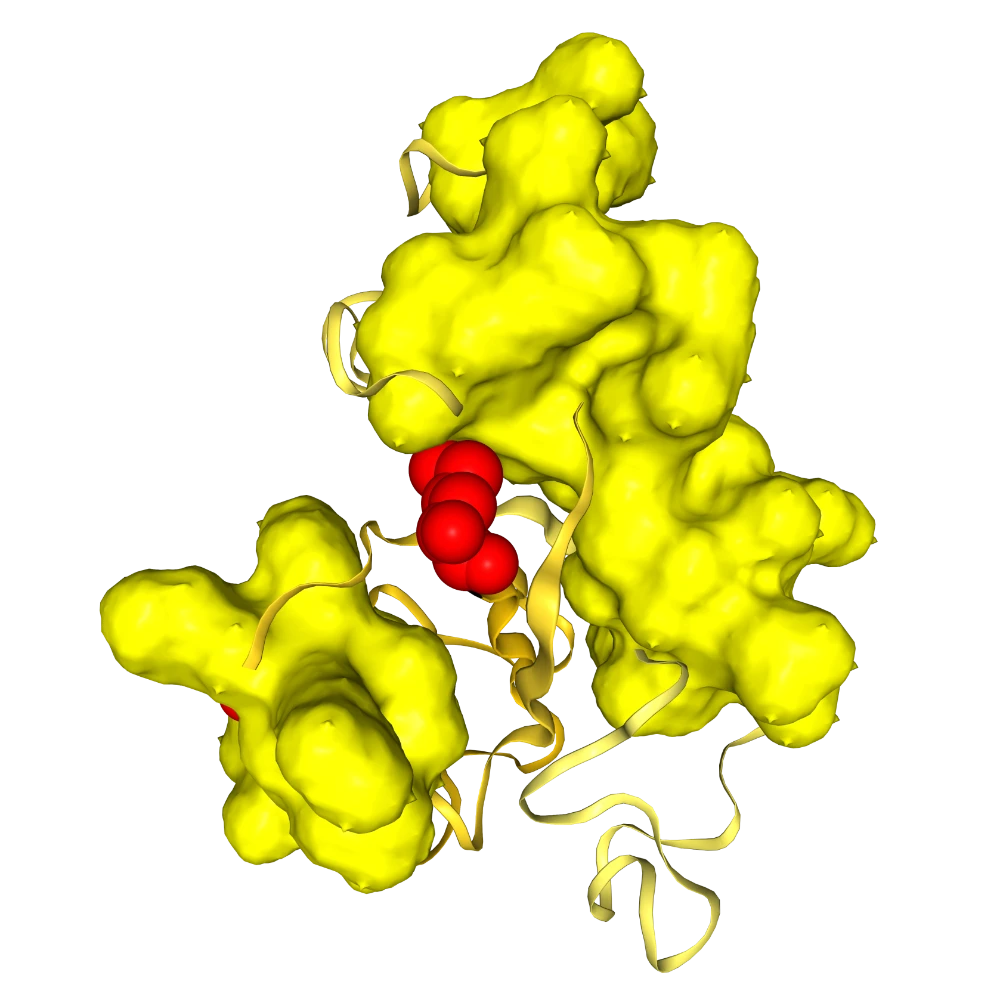
change all helices to yellow surface and all M residues to red dots
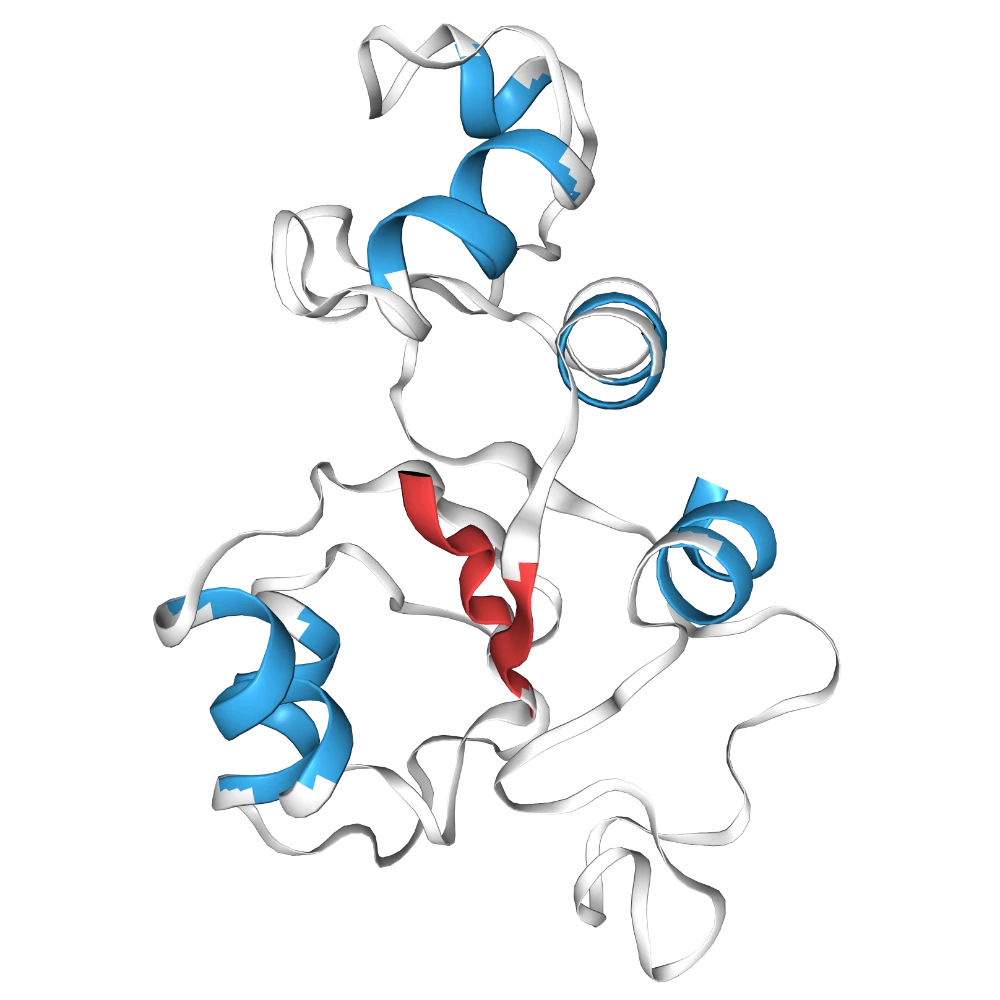
Change to cartoon to be colored white, then color sheets #FF4747 and helices #38AAEA
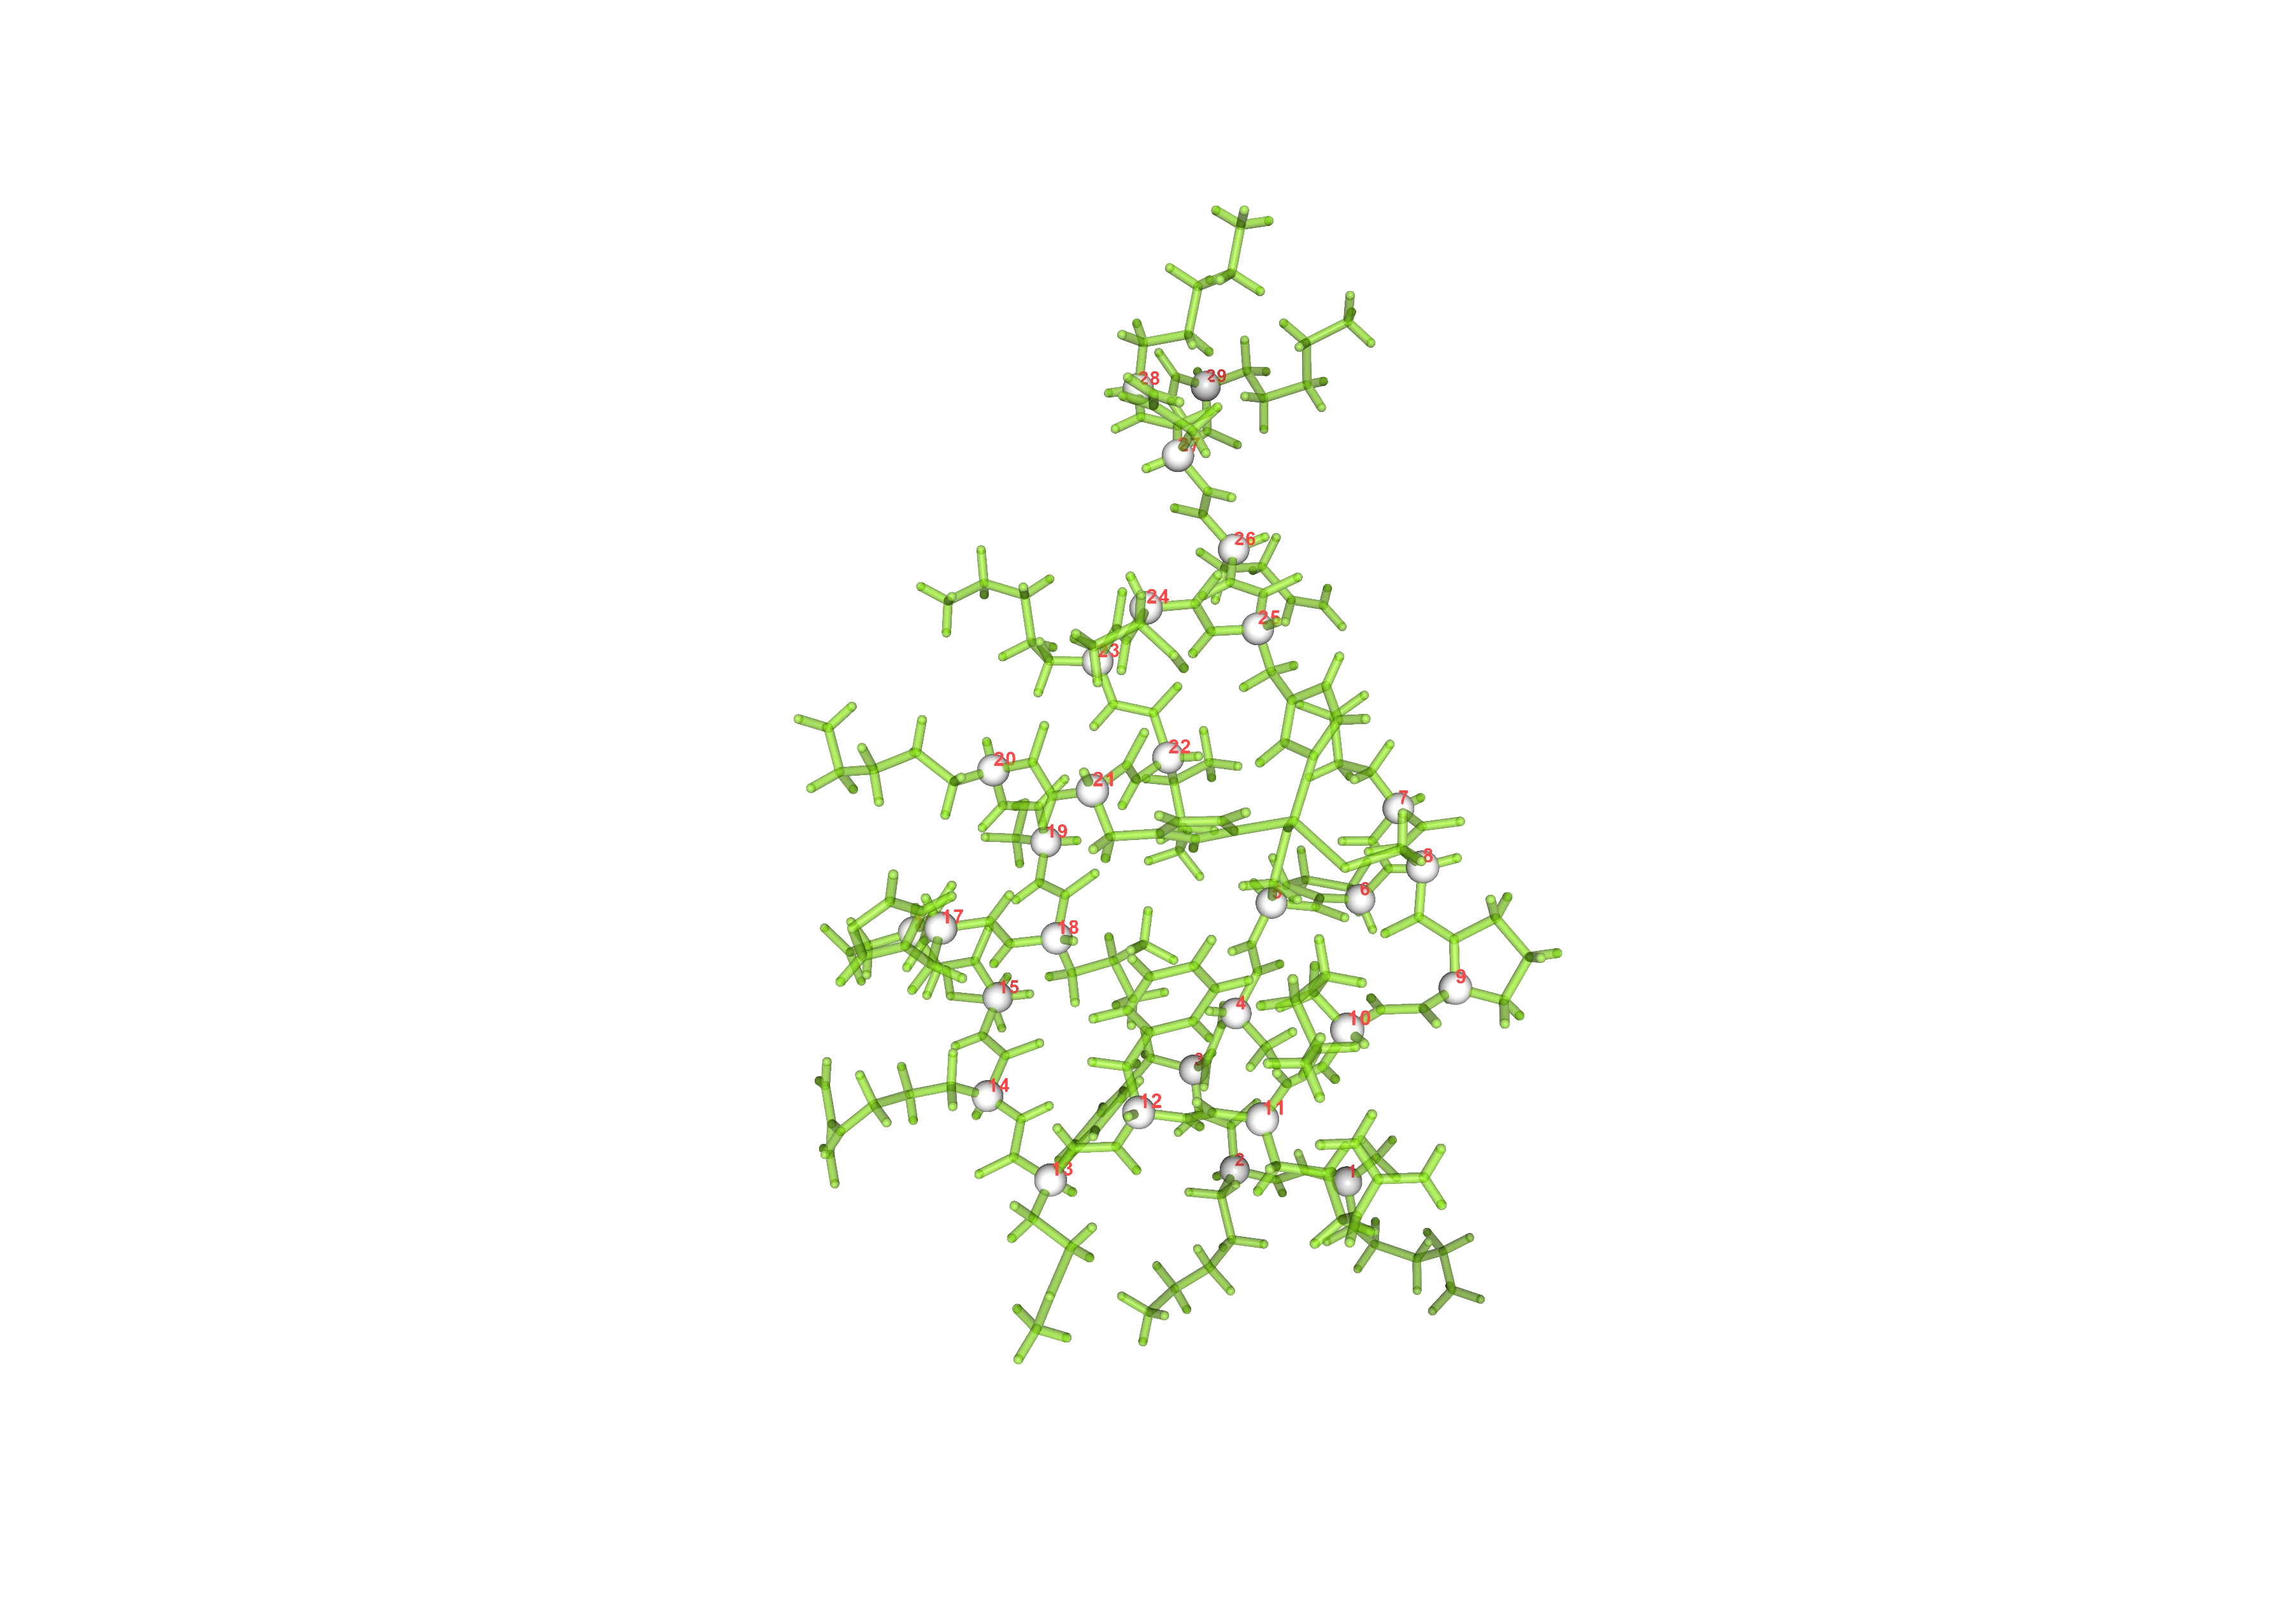
Hide cartoon, color the licorice #85DB18 with opacity 0.7, show CA as spheres with size 0.3 in white and label all CA with resno in #FF4747
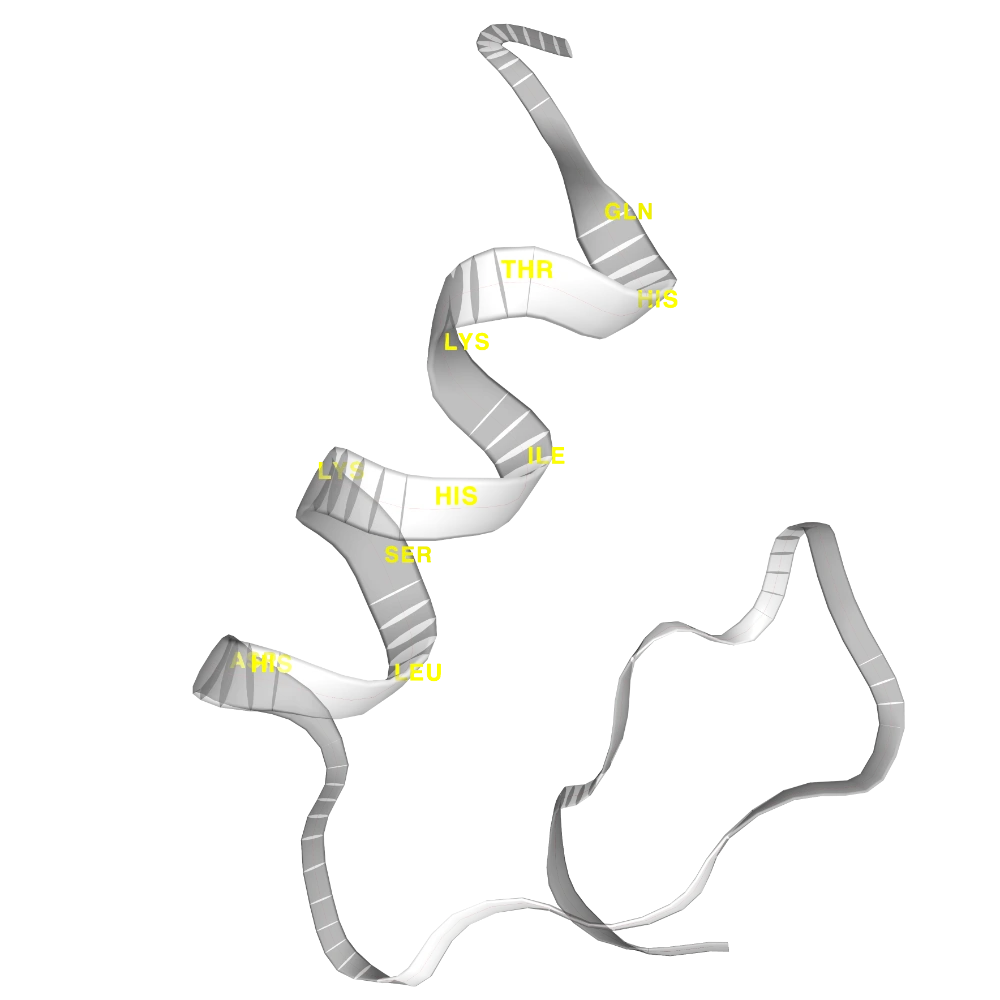
Show trace in #FF4747, show cartoon in white with opacity 0.5, and label helix CA with resname in yellow
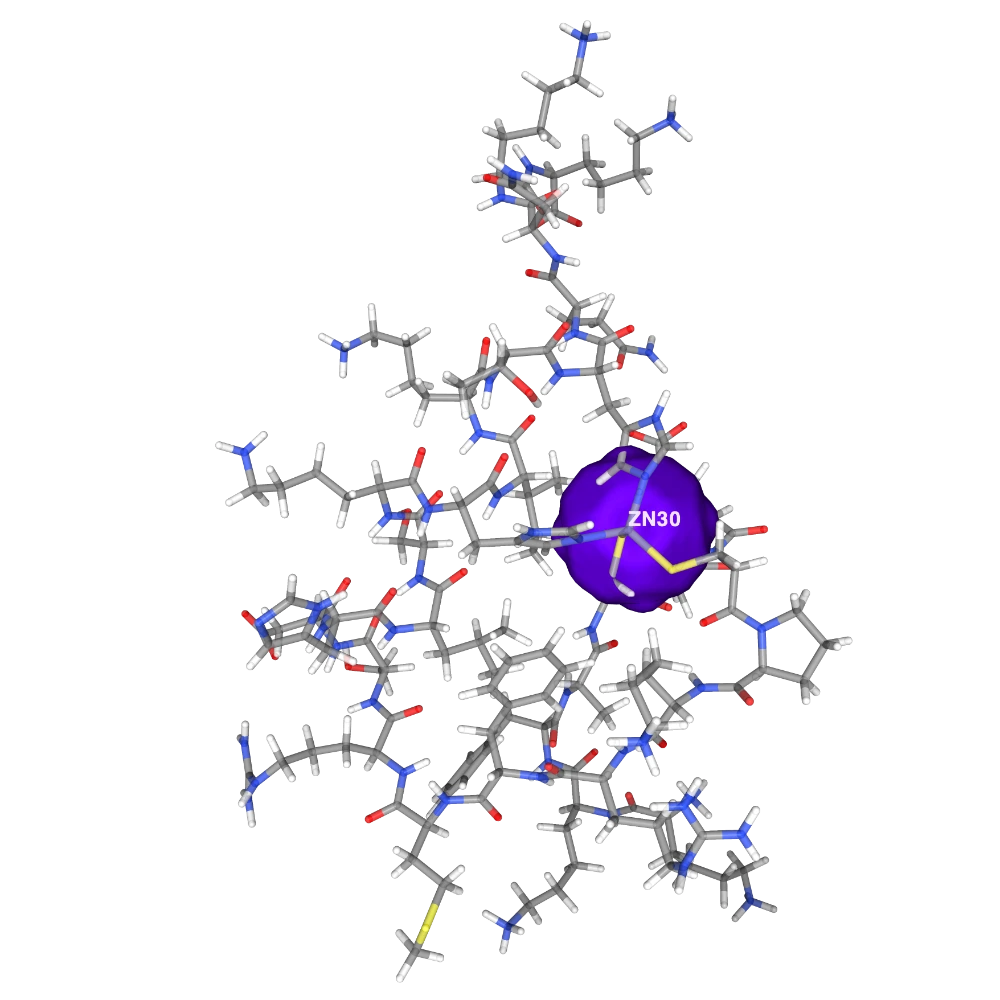
Hide cartoon, show licorice colored by element with opacity 0.8, show ions as surface with opacity 0.1 colored #7000FF, and add label for ZN in white
